
Dividend tracker
A Review of dividend tracker site: trackyourdividends.com

If you have invested in stocks that are paying dividends – which I believe you should – then a dividend tracker is a necessity. Especially if you are a dividend investor, meaning you invest exclusively or mainly on dividend paying companies, this tool is really crucial to your success.
One such tool that I have found very convenient and I would highly recommend is: trackyourdividends.com.
It is a very easy to use tool but has nice & very useful features. Most of these features are completely free to use but there is also a paid subscription for some more advanced tools. Also, the paid subscription is very affordable – perhaps the most affordable subscription on any site out there that deals with the stock market.
Let’s dive in the features and tools that you can use without further ado.
Dashboard

Overview of your Holdings
In the top side of your dashboard, you see a summary of all your holdings. Also you can have multiple portfolios that you can track or measure their performance separately. In my case I have split my portfolios per broker, so I have two: Interactive Brokers and Revolut. By pressing each portfolio in the tab area you can see its performance.

Below the portfolio selection tabs, there is an outline area where you can see your portfolio dividend yield (%) and yield based on your cost (%). The yield on cost, reflects the percentage of dividend you earn based on your purchased prices. For example, I have purchased Nucor Corp. (NUE) at $ 42.73 and the current price is: $148.24. Respectively the current dividend yield is: 1.38% but since I have purchased it almost at 1/3 of the current price, my yield on cost on this share is: 4.77%.
Also in the outline area you see your annual income and your portfolio Beta.
Detailed View per stock
Below the outline, you see your holdings per ticker with the most important data you need to keep track of. That is: number of shares, current price, change (%), your average cost, your total position’s profit/loss, the dividend yield & yield on cost respectively and the annual income. In the last column, there is the dividend safety score which is a paid feature. So in my case, as you may already noticed in the picture below, this feature is locked 🔒.

You can also share your portfolio (via a shared link) or export it in Excel, CSV or PDF.
Add new Holding
To add a new holding, you simple press the blue [+ Add Holding Button] at the top right corner of your dashboard. You then get an input screen, just like the below picture in which you just enter the basic data:
- Which portfolio to add your holdings (e.g. Interactive Brokers in this case below)
- the ticker
- number of shares
- and the cost per share

Diversification
The next menu item that is available to all users is the diversification of your portfolio. There, one can see how their is portfolio spread in sectors and industries.
In the picture below, you can see how my portfolio is split into the main sectors: Defensive, Sensitive & Cyclical. You can easily drill down to each sector, into sub-sectors and individual stock.

Also, some useful metrics are displayed below the sector split, such as the number of total sectors, the largest sector & holding, highest dividend payer, etc.
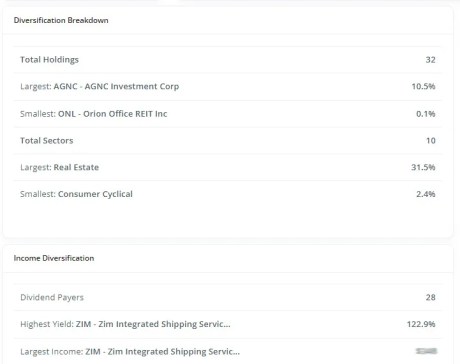
After those metrics, there is a report of your exposure to each sector. In essence you see the share (%) of each sector & sub-sector in your portfolio.

Similar to the sector analysis, is the industry analysis, where one can see in detail each of the industries on their portfolio.
Upcoming Dividends
One of the most useful functions is the ability to see your upcoming dividends. This menu item, displays an overview of amounts you expect to see per month. Moreover, a payout calendar displays your expected dividends per ticker & month. Lastly, you can see what dividends have been already confirmed.
Expected Dividends (per month)
In the picture below, you see an overview of what I expect to collect per month in dividends. As you see, in some months my expected income is significantly higher than others. This chart can help an individual improve their dividend investing strategy. For instance, in my case, if I want to balance my monthly income, I need to increase my positions in companies that pay dividends in Mar – May – Aug – Sep – Nov – Dec & Feb.

In the next report, we will see exactly how we can balance our portfolio in such a case (as discussed above).
Stock Payout Calendar
A monthly calendar of your dividend paying stocks is an excellent overview of what you expect to receive each and every month. It can also help you rebalance your portfolio based on what you are aiming for. For example, if I want to increase my income on May, I can increase my current positions on stocks like: Apple, Abbvie, Dell, etc. or find new stocks that pay dividends on that particular month.

Confirmed Dividend Calendar
Next, we see two reports on the dividends which are already confirmed by their companies.
There is a rolling calendar of the current and next month in which one can see in detail, every day that they expect dividends. If you -like me- want to schedule your portfolio in a way that you can receive dividends every single week, then this calendar can help you plan your strategy accordingly. In the screenshot below you can see that in my case, every single Friday during March, I received dividends. Next goal? Perhaps, plan to receive every single day!

The next report we see, is a detailed table of the companies that have confirmed their dividends, together with their relevant data.
More specifically, for each company we see the dividend amount per share, the total amount we expect to receive (i.e. amount per share * number of shares we have) and the payment date. Here, a premium member can also see the safety score for each stock.

Future Value
The next menu item is the future value. Here we can see some forecasts of the future value of your portfolio and the expected income in dividends per year. Those forecasts are based on some assumptions which reflect the current market conditions.
Projected Balance & Income

In the above chart we see how my portfolio is expected to increase over the next 10 years. Moreover, I get a forecast of what my annual income is expected to be over that period of time.
Market Assumptions
Market conditions change rapidly, so you may want to simulate various scenarios and see how you will be impacted. You can change the basic assumptions of the above charts and run those forecasts again.

For example, you can change the default price appreciation of your portfolio from 3% to 4%. Or reduce your dividend growth rate from 5.81% to 3%. By all means, those assumptions need careful consideration and you may have to spend quite some time researching.
A very useful feature of this tool is that you can also input an amount of annual contributions. This way, you can forecast your balance & annual income, taking into consideration what new investments you are planning to do. As you can easily guess, even a modest amount of annual contribution to your portfolio, can greatly increase your final outcome both in balance & in dividends.
Moreover, you may want to increase the charts time horizon, from 10 years which is the default, up to 25 years. After all, investing is a long-term sport.
Research & Education
Finally, there are two extra menu items: Research & Education. Most of those features are reserved to the premium members so I will not cover those at this time. I want to just briefly mention that in the research menu, one can research for dividend paying companies to invest, run a dividend screener, find ideas & popular stock, etc. In the education menu respectively, one can find educational material about investing in dividend stocks, portfolio building strategies, etc.
Final Thoughts
I have tried to keep this review relatively simple & brief. It may appear lengthy in size but this is mainly due to the screenshots.
trackyourdividends.com is a website that I visit almost on a daily basis. I use it to track my performance and see my upcoming dividends. I have also set-up alerts every time a company pays or announces a dividend (payment & ex-dates respectively). Those alerts come in my email inbox. When I need some extra motivation to carry on, I visit the future value and see what I will be getting in 20 years from now in passive income. That is a great way to stay motivated and aim for the long run.
Disclaimer: I want to clarify that I am not affiliated with this site. I have not been paid to promote it, or been asked to write a review or in any way related to this site or team behind it. I just use it a lot, like it and I would like to recommend it to my readers.


